Report designer
It is possible to create pdf reports for Hugin models. Creating reports is done in two steps,
- Designing the layout and specifying the information to be included
- Generating the actual report and saving it to a pdf file.
Generating the pdf file is done in the Analysis Wizard by pressing the "Generate Report" button in the "Data Source" tab. The "Generate Report" button is enabled if at least one report is designed for the current model opened in Hugin and if cases are imported in the Analysis Wizard. Selecting the "Edit report generetor templates" in the "Network" menu, launches the Report Designer that allows the user to configure one or more reports to be added to the currently active model.
The Report Designer (Figure 1) consists of three main sections:
- The top section where a drop down box and a delete button are located. The drop down contains a list of all reports designed for the model currently loaded and allows the user to select one of them to be loaded in the designer. The "delete" button deletes the selected report.
- The toolbar on the left side of the designer panel (Toolbar).
- The Layout section in the middle of the designer panel displays a rough layout of the user specified information that will be included in the generated pdf file.
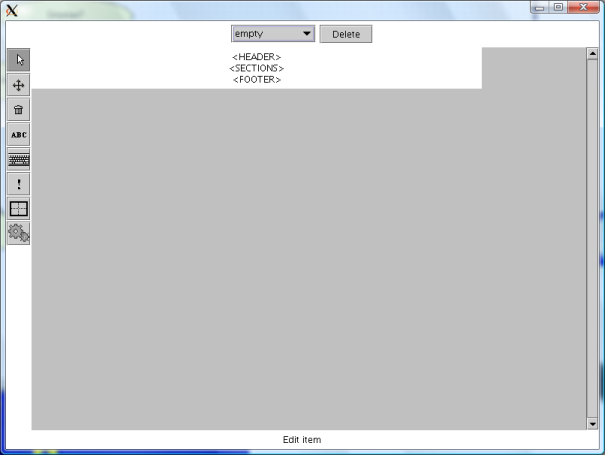
Figure 1: The Report Designer
Tool bar
The toolbar consists of eight buttons that allow the user to perform certain tasks while designing a Report. Following, is a short description of each button. To better understand how to use them please go to the Layout Section.
 Pressing the "edit" button and then selecting a component in the layout section will launch the properties panel for the selected component. The properties panel allows the user to edit the component.
 Pressing the "move" button allows the user to select and move a component on the layout section.
 A component in the layout section can be deleted by selecting the component after having pressed the "delete" button.
 Pressing the "text" button and then a cell in a table in the layout section will launch the text properties panel, where the user can specify text to be added at the selected location and define its size, font and alignment.
 Selecting a cell in a table in the layout section after having pressed the "user input" button, launches the properties panel for user input. Here the user can specify what information should be given by the user that generates the report. This information will be added at the selected location when the report is generated. In other words the person that will generate the report in the Analysis Wizard will be prompted to input the information defined in the user input properties panel.
 Pressing the "auto generate" button and then selecting a cell in a table in the layout section launches a panel that allows the user to add auto generated content like a date, the file name, etc in the selected cell.
 The "table" button launches the table properties panel that allows the user to add a table in the report and define the number of rows and columns. A table is used to add additional information by using the "text", the "user input" and the "auto generate" buttons.
 The "data" button allows the user to add a section that represents results based on user provided data that are cases for the currently loaded model. Pressing the button and selecting a location in the layout section will launch a panel prompting the user to specify a description for the new data section which is added to the report.
The layout section
When the Report Designer panel is opened for the first time, it looks like in figure 1. The first step for designing a new report is to click in the layout section to display the Report properties panel (Figure 2) for specifying the name, the header and footer of the report.
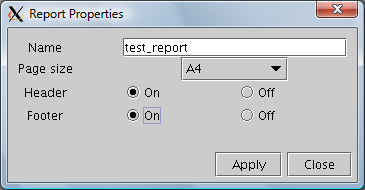
Figure 2: The Report Properties pane
Input a name in the text field and select whether or not the footer and the header should be displayed. In this example we call the report "test_report" and we allow a header and a footer. Apply the changes and press close to close the panel. The report now looks like in figure 3.
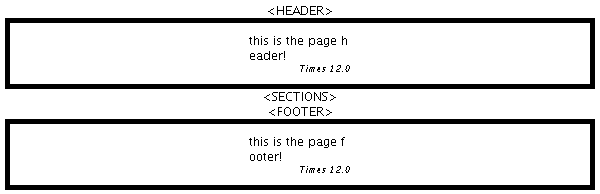
Figure 3: The report layout after adding a header and a footer
To change the text in the header press the "edit" button in the tool bar and select the header section. The Text label properties panel (Figure 4) is launched that allows editing the text in the header. Apply the changes and close the panel.
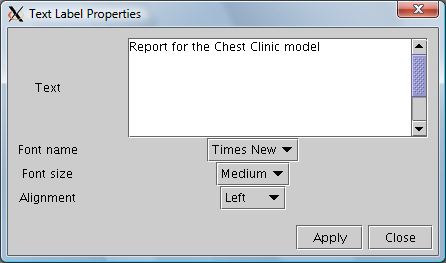
Figure 4: The text labels properties panel
Follow the same steps to edit the text in the footer.
The next and most important part of designing a report is adding the main content. Press the "data" button and select the area between the header and the footer. The Section Properties panel prompts for turning the description area on or off. Turn the description on and apply changes. The centered section now consists of the description area (top) and the results area (bottom). You can choose to add a text in the description area just like we have done when editing the header and the footer or you can add a table that will allow you to insert multiple types of information as part of the description.
To add a table to the description press the "table" button and then select the description area. In this example we add a table with one row and three columns to be able to test all three types of information. If there is a text label in the description area you will have to remove it first in order to be able to add the table. Removing a component from an area is done by pressing the "delete" button and then selecting the component to be deleted.
Press the "text" button and select the first cell of the table to launch the Text Label Properties panel and input some text to be added to the cell.
Press the user input button and select the second cell of the table to add text that describes the information the person who will generate the report has to input. In this example we add "Generated by:", so the user will be prompted to input his name when generating the report.
Press the "auto generate" button and select the third cell of the table to add information that is automatically generated when the report is generated. The "Auto Generated label properties panel" allows you to specify this information. In this example we add the date on which the report was generated.
After completing the steps above the layout of the report should look similar to figure 5.
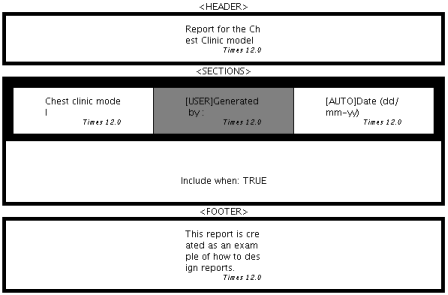
Figure 5: The report layout after completing the steps above
The last step of designing the report is to actually specify the type of results that should be generated when reading cases for the loaded Hugin model. To do this press the "edit" button and select the bottom part of the center section. This will launch the Lines Properties panel shown in figure 6.
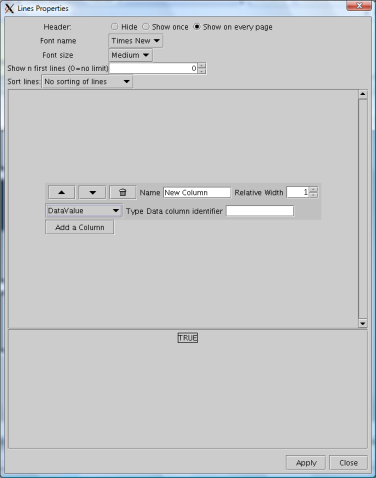
Figure 6: The Lines Properties Panel that allows the user to specify the type of information generated on each line of the report
In the "Lines Properties Panel" you can specify the font and size of the text, the way of sorting the information and how to display the headers (hide, show once and show on every page). But most importantly you can add various types of columns to the report. After pressing the "Add a Column" button that is initially located at the center of the panel a form is displayed awaiting user input for describing the first column in the report. The user can select between the following options in the drop down box:
- Single State Belief: Selecting this option configures this column to display the belief of a state of a specified node. A form is shown that allows the user to input the name of the column and select a node and one of its states.
- Highest Belief State: Selecting this option configures this column to display the state of the selected node with the highest belief in every case. A form is displayed that allows the user to specify the name of the column and select one node.
- Data Value: This option displays a form that allows the user to type in the name of the column in the report and a column identifier in the case file. By selecting this option the report column is configured to display the value of the column with the given data file column identifier, for each case. (The column identifier should be given exactly as it is in the case file).
- User Value: This option displays a form that allows the user to input the column name and an input identifier. The input identifier will be displayed to the person that will generate a report while prompting him to input a value. In other words the input identifier should be a message to the user that generates a report, describing to him what type of information he should input for this column.
- Case State: Selecting this option configures the column to display the case state for a selected node in each case in the case file. A form is displayed prompting the user to enter the column name and select a node.
In this example we have added five columns, one of each possible type. The following image (Figure 7) shows the layout of our report at this point.
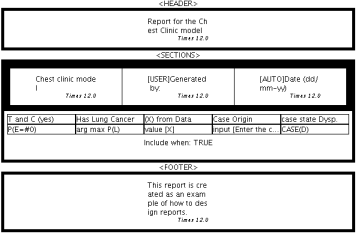
Figure 7: The report layout after adding data columns
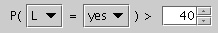
The bottom part of the Lines Properties panel is where we can define rules for the results we want to be included in the report. As default the rule is "TRUE" which means that all results generated while parcing the cases are included in the report. If for example we are only interested in results where the probability of (L) Has Lung Cancer = yes is higher than 40, we can define a probability rule to express this. Right click on the "TRUE" node and select "Switch to PROBABILITY" (Figure 8).
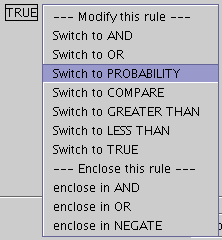
Figure 8: The layout for altering rules
The "probability" rule is displayed (Figure 9) instead of the "true" rule. Select "L" as the node to apply the rule on, select state = yes and set the threshold to 40. Now only cases where "P(L=yes)>40", will be included in the report. It is possible to combine multiple rules by right clicking on the probability rule and selecting one of the "enclose" options from the drop down menu. These steps can be repeated, selecting various type of rules, until we have the desired rule.