Tokens in a box
We can illustrate belief modelling and an automated decision making process with a very simple example.
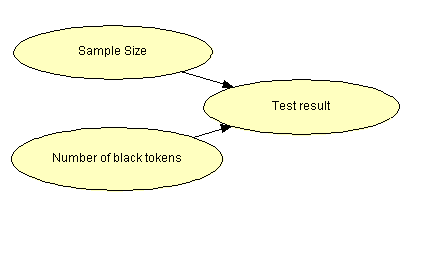
A simple example of a Bayesian Belief Network, called the "Tokens in a box" network, is illustrated in the figure below. The "Tokens in a box" network illustrates the roles of information, evidence and dependency in an uncertain domain. Additionally the simple "Tokens in a box" model can be extended to include decisions and utilities in order to highlight how Bayesian Belief models can be used to support decision making under uncertainty - the corresponding domain model is also shown below.
The "Tokens in a box" network represents a simple situation or model domain; ten coloured markers in an opaque bag. Each marker is either white or black but the actual colours are unknown. The only information that can be obtained about the colours of the markers comes from sampling tests. In a simple sampling test a marker is taken from the bag and examined, to reveal its colour, and then returned to the bag. More complex tests involve taking several markers from the bag, one at a time but returning them and shaking the bag before each successive removal, to reveal a sequence of colours. We only consider two results for a complex sampling test; either all the markers removed from the bag are observed to be white (called the negative result) or at least one of them is observed to be black (the positive result). Although this is a very contrived model it is clear that similar statistics and arguments relate to many realistic sampling or contamination processes - statisticians call this inspection process sampling with replacement'. The pertinent question, addressed by the "Tokens in a box" network, is "What do the results of sampling tests tell us about the colours of the markers in the box?"
The fundamental uncertain variable in this problem is the number of black markers in the bag; it is represented by the node "Number of black tokens" in the Belief Network. In this domain the "Number of black tokens" variable can take only eleven different values, the integers 0 - 10, representing the number of black markers in the bag. Initially each state of the black marker variable has a probability of 1/11 (=0.090909) expressing total ignorance of the number of black markers. The two other uncertain variables included in the network are called "Sample Size" and "Test result". These represent the length of the testing sequence and the outcome of the test. We have allowed the test sequences to have length "Sample Size" = 1, 2, 5, 10 or 25 (although this is arbitrary); the outcome of the test has only two states, true and false, as indicated above. The arrows connecting the "Test result" node to its two parent nodes indicate that the result of a test is dependent on both the actual number of black markers in the bag and on the size of the sequence. A quantitative form of this dependency, based on binomial statistics, is incorporated in the network model; it is expressed by the set of conditional probabilities P("Test result" = true | "Number of black tokens", "Sample Size") and P("Test results" = false | "Sample Size", "Number of black tokens") which can be calculated, for all possible values of "Number of black tokens" and "Sample Size" (P("Test result" = true | "Number of black tokens", "Sample Size") = (1-"Number of black tokens"/10)"Sample Size" ).
We have used HUGIN BIOTRACER to implement the "Tokens in a box" model. The HUGIN BIOTRACER tool is particularly easy to use and can be appreciated by inexperienced users. Within HUGIN each node can be inspected by opening a monitor window to reveal the details of the states and the associated marginal probabilities.
Initially the sample size variable has a uniform set of prior probabilities; P("Sample Size" = n) = 0.2 for each value n. In practice this variable is used to represent the precise form of a particular test and a particular value can easily be chosen using the HUGIN BIOTRACER tool (a double click on the appropriate state of "Sample Size"). When a specific state is chosen in HUGIN the corresponding bar' of the probability chart goes red and it has an associated probability of unity (i.e. the sample size is certain). Fixing the sample size establishes one particular pattern of removal events but has no direct effect on the belief concerning the number of black markers in the bag. However in this condition, the "balls in a bag" network can immediately express the consequences of any evidence i.e. the result of the particular test. When we observe a negative test result, indicating that all the markers removed from the bag were white, the probabilities associated with the numbers of black markers in the bag change. A negative test from a single removal means that the probability of ten black markers in the bag is identically zero and that the probability of no black markers in the bag is 2/11 (0.181818). All the intermediate probabilities also change from the uniform values that corresponded to complete ignorance. It is equally straightforward to evaluate evidence from longer tests, such as 2, 5, 10 or 25 markers removed in sequence. A sequence of twenty five observations in which the removed marker was white each time (i.e. a negative test of size 25) leads us to believe that the probability that all the markers are white is 92.9%. The update is instantaneous in HUGIN BIOTRACER. It is important to note that, during operation, the belief network is expressing the probabilities P("Number of black tokens" | "Sample Size", "Test result" = true) etc.; the opposite of the conditional probabilities used to construct the network. This inversion, which is performed consistently and quickly even in large networks, is the fundamental element of Bayesian inference. It is a direct application of Bayes' theorem and is implemented very efficiently in tools like HUGIN BIOTRACER.
Hence, a closed box contains ten tokens. Although we know that each token can be either black or white we do not know the actual colours of the tokens. We know white tokens are best so we would like to be sure that all the tokens in the box are white.
We could test the tokens to do this we take a token from the box, examine it to see whether it is white or black, and return it to the box. Obviously we could repeat this test several times to get better information about the colours. If we keep testing and the answer is always white we would be increasingly confident about the quality of the tokens in the box even though there is a small chance that we keep taking the same token from the box! This complex situation can be represented as a Bayesian network as explained above.
The arrows in the network tell us that the result of our testing (whether all the tokens we pull out are white or not) depends on the number of black tokens in the box and on the number of times we take out a token and look at it. The Bayesian network can be used to compute the posterior belief concerning the number of black tokens in the box based on the result of a test.
Number of black tokens
Sample size
Result
You can use the web form above to prime the network with a test result and then a bar chart indicates what you should believe about the number of black tokens in the box based on the test. No test can be categorical so the computed belief is still a probability but the probability falls on the side of the test results.
The Tokens in a box network is a trivial example that illustrates a simple Bayesian Belief Network methodology and an implementation using the HUGIN BIOTRACER web solution. However, in addition, this construction also indicates how causal information can be encoded to give a practical, quantitative, representation of an uncertain domain and how accountable decisions, based on evidence, can be established when complete details can not be obtained.