Fraud detection
Before any reports can be generated, a report template must be designed and stored in the model. This is done using the HUGIN BIOTRACER tool (see the Report Designer tutorial for how to design a report template). The report designer can be seen in Figure 1.
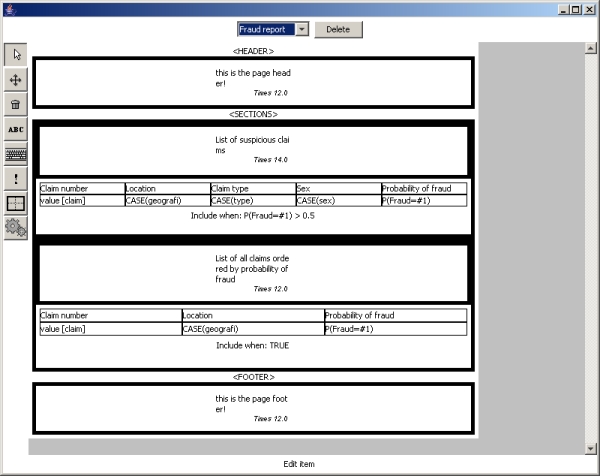
Figure 1: Report designer dialog
To generate a report the user must log in to the system and perform a number of steps.
Step 1:
Browse the model repository and find the desired model, right click and select the opton 'Batch process data' (see Figure 2).
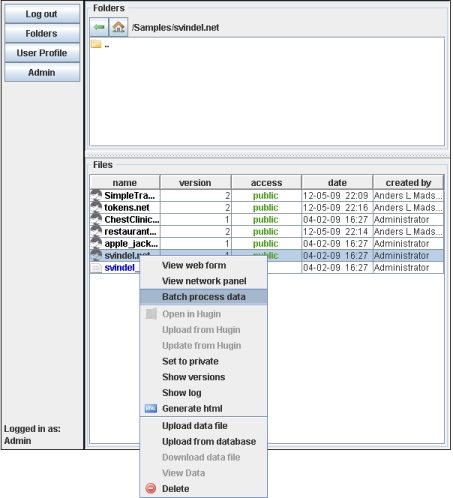
Figure 2: Select model and choose option 'Batch process data
Step2:
A data source must be specified. The user can choose to use a data file residing on his local computer, or choose a data file that resides in the repository on the HUGIN BIOTRACER Web Solution. In this example data is loaded from the repository (see Figure 3).
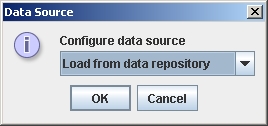
Figure 3: Configuration of data source
Step 3:
Browse to find the desired data file (see Figure 4).
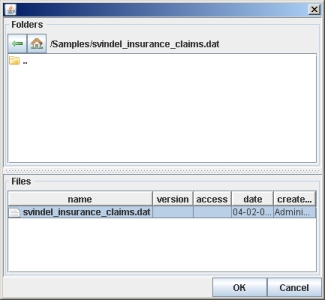
Figure 4: Browse for data file
Step 4:
Reading the data file. In order to load the data file, the system needs to know what symbol separates the columns of data in the file. This symbol can be speficied in the next dialog (see Figure 5). To aid the user in specifying the correct separator symbol the system displays the data columns that can be inferred as the user enters the symbol.

Figure 5: Specification of seperator symbol
Step 5:
Map data entries to nodes in model. This is done by selecting a corresponding node for each data entry (see Figure 6).
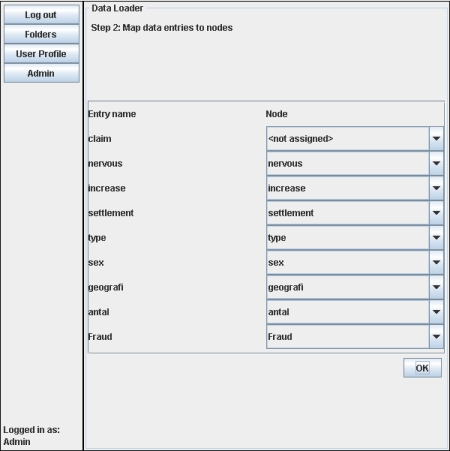
Figure 6: Mapping of data entries
Step 6:
Select report and specify target file (see Figure 7).
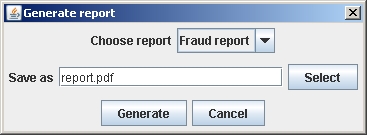
Figure 7: Choosing report and specifying target file
Step 7:
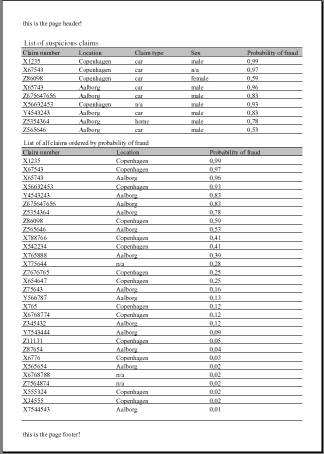
Click the 'Generate' button. A PDF-report is generated and saved to file. The report can be inspected using a PDF-reader. Figure 8 displays a screenshot of a report.